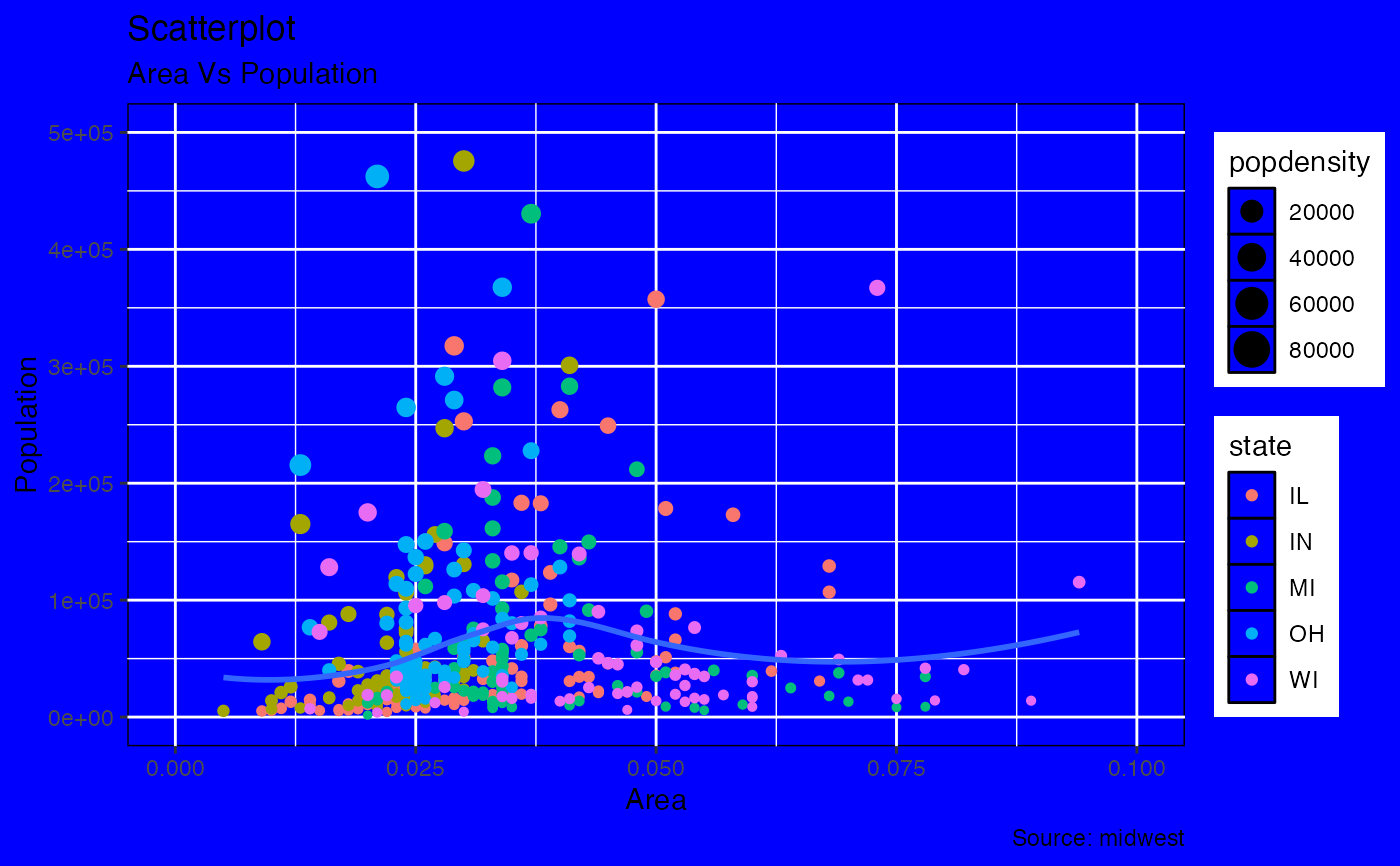
Easily change the background color for a ggplot. Changes both the panel
and plot backgrounds to the same desired color_bg. Can also change the
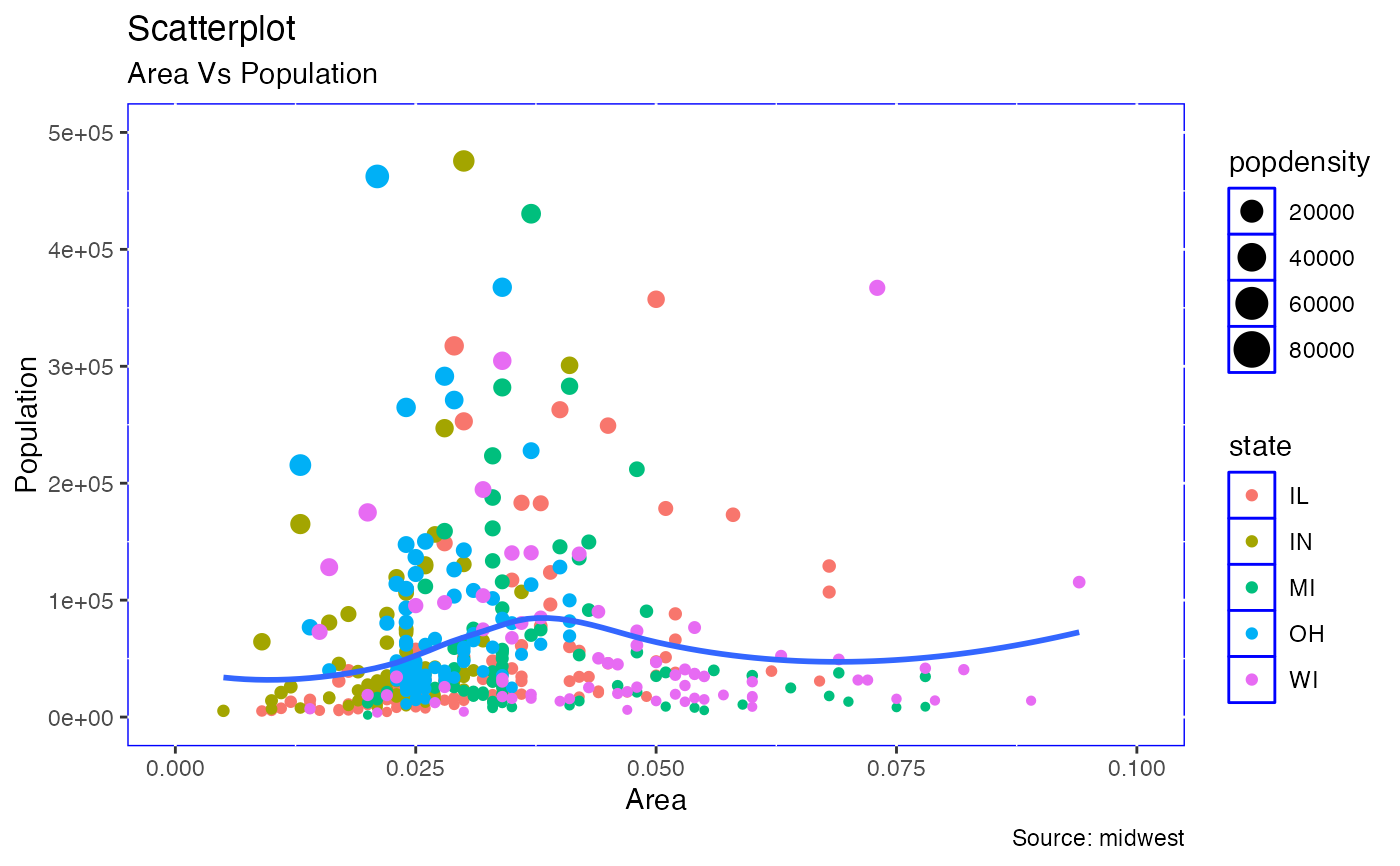
border color of the plot with color_border
background_color(color_bg = "white", color_border = "black")Examples
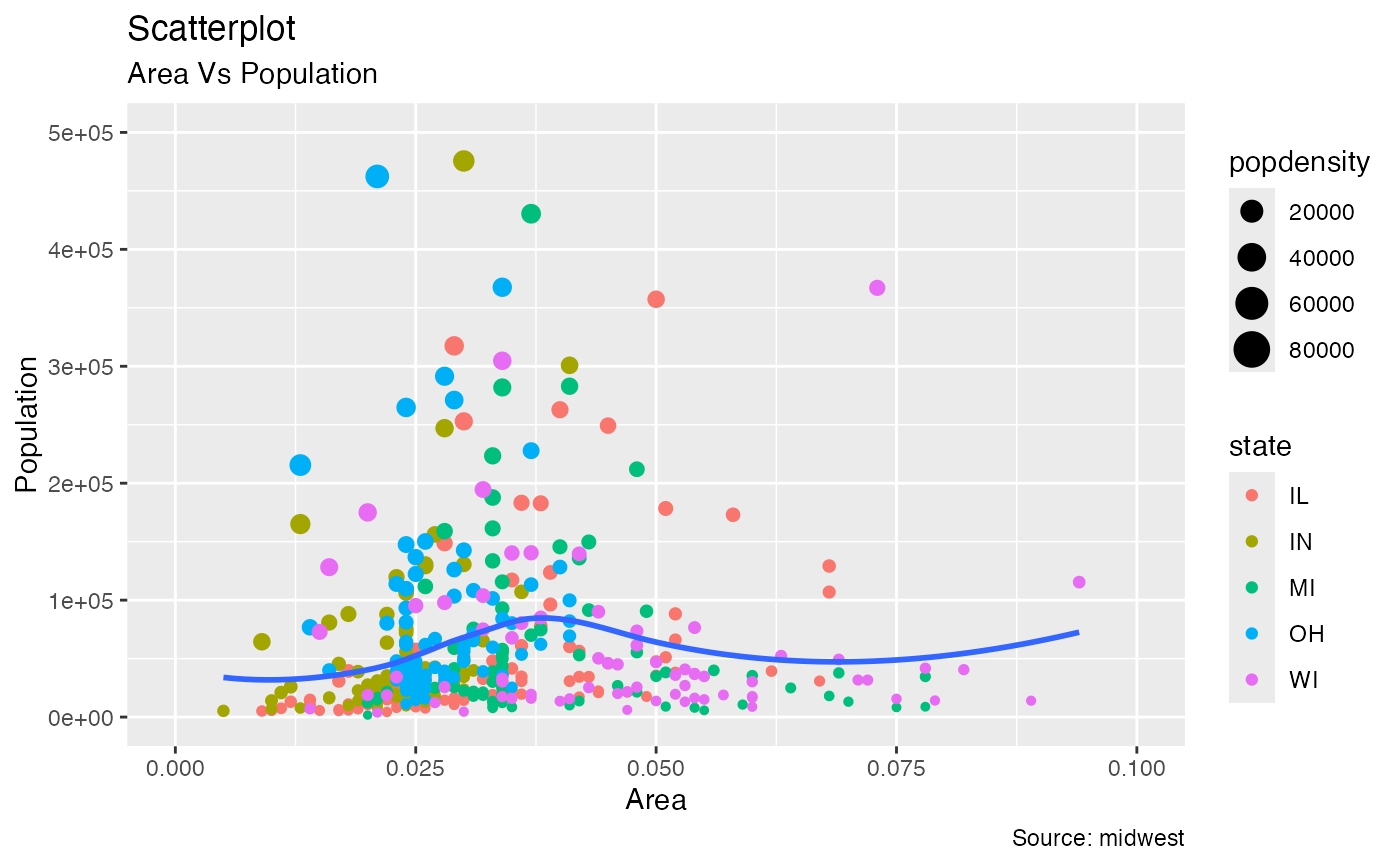
# Make example plot:
library(ggplot2)
data("midwest", package = "ggplot2")
plot <- ggplot(midwest, aes(x = area, y = poptotal)) +
    geom_point(aes(col = state, size = popdensity)) +
    geom_smooth(method = "loess", se = FALSE) +
    xlim(c(0, 0.1)) +
    ylim(c(0, 500000)) +
    labs(subtitle = "Area Vs Population",
        y = "Population",
        x = "Area",
        title = "Scatterplot",
        caption = "Source: midwest")
plot
#> `geom_smooth()` using formula = 'y ~ x'
#> Warning: Removed 15 rows containing non-finite outside the scale range
#> (`stat_smooth()`).
#> Warning: Removed 15 rows containing missing values or values outside the scale range
#> (`geom_point()`).


# Change the background color to blue
plot + background_color('blue')
#> `geom_smooth()` using formula = 'y ~ x'
#> Warning: Removed 15 rows containing non-finite outside the scale range
#> (`stat_smooth()`).
#> Warning: Removed 15 rows containing missing values or values outside the scale range
#> (`geom_point()`).


# Change the background color to white and border to blue
plot + background_color(color_bg = 'white', color_border = 'blue')
#> `geom_smooth()` using formula = 'y ~ x'
#> Warning: Removed 15 rows containing non-finite outside the scale range
#> (`stat_smooth()`).
#> Warning: Removed 15 rows containing missing values or values outside the scale range
#> (`geom_point()`).
